Robotic surface finishing (grinding, polishing, deburring, and bevelling) provides manufacturers with many financial benefits. For example, it radically increases production output, quality, and predictability. Robotized finishing is also more cost-efficient than manual work. Despite the many advantages, manufacturers struggle to determine the two financial indicators needed for assessing a robot investment – payback time and return on investment (ROI). Without credible numbers, manufacturers cannot make up their minds on whether to go or not go robotic.
This article helps you assess your surface finishing robot investment. It explains how to calculate the payback time and ROI for grinding, polishing, deburring, and bevelling robot. You can download our investment calculator with best-practice industry input values, helping you to create a convincing business case!
Please note: Health and safety factors, availability of labour force, as well as quality & traceability requirements should be considered before making a final decision. Our investment calculator is a supporting tool.
Robotized surface finishing provides manufacturers many benefits. Some of them can be quantified in financial terms, whereas some advantages are non-quantifiable yet significant, such as higher quality and minimized health risks.
Assessment of the surface finishing robot investment begins from estimating and quantifying the potential financial benefits and comparing them with current, manual surface finishing operations costs. The financial benefits to be used for investment assessment are summarized below.
Robotization increases surface finishing process speed, efficiency, and output. Robots perform the operations faster than humans and at a constant and uniform pace, every day, from one shift to the next. With an optimally programmed grinding robot, you can achieve up to three times higher total tool-on-contact time than manual work by minimizing the time used for non-value generating air movements and tool positioning. The number of scrapped parts and waste is also minimized. As a result, the manufacturer saves operational costs compared to manual work, accelerating the payback time and increasing ROI. Excessive robot capacity (if available) can be used to increase the production capacity and generate extra revenue to improve the payback time and ROI further.
What’s payback time?
The payback time refers to the period it takes to reach the break-even point and recover the costs of a grinding robot investment, including all associated expenses incurred. Typically, robotized surface finishing pays back the costs via savings gained or additional revenue generated compared to the existing manual operation.
What’s Net Present Value?
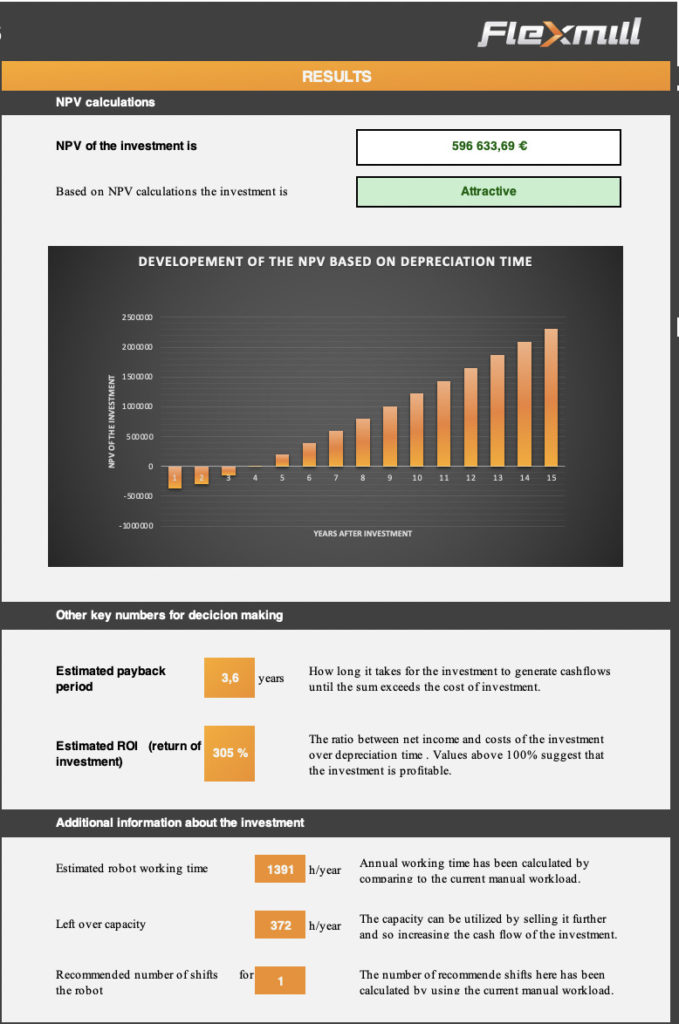
Because the robotic investment typically generates value over a multi-year lifecycle (e.g., 10 years), the time value of money must be taken into account to discount the streams of future savings and revenues into today’s value, i.e., the net present value. The discount rate can be derived from the cost of the capital required to make the robot investment. If the NPV of the investment, i.e., today’s value of all future savings and revenues generated by the robot, is positive, it means the robot is a profitable investment.
What’s the return on investment (ROI)?
Return on investment (ROI) is the ratio of the net present value (NPV) of the financial benefits a manufacturer gains with the grinding robot (i.e., additional savings and revenues compared to manual work) in relation to the robot investment costs. The higher the ratio, the more profitable the robot investment is. ROI calculation allows the manufacture to decide whether to take or skip the investment.
Determining the payback time and ROI for a surface finishing robot is not straightforward. You need to estimate the cost structure of your manual surface finishing operations, the robotization investment, and robotic operational costs over a multi-year lifecycle. To arrive at a reliable estimation, we recommend a three-step approach in the following order:
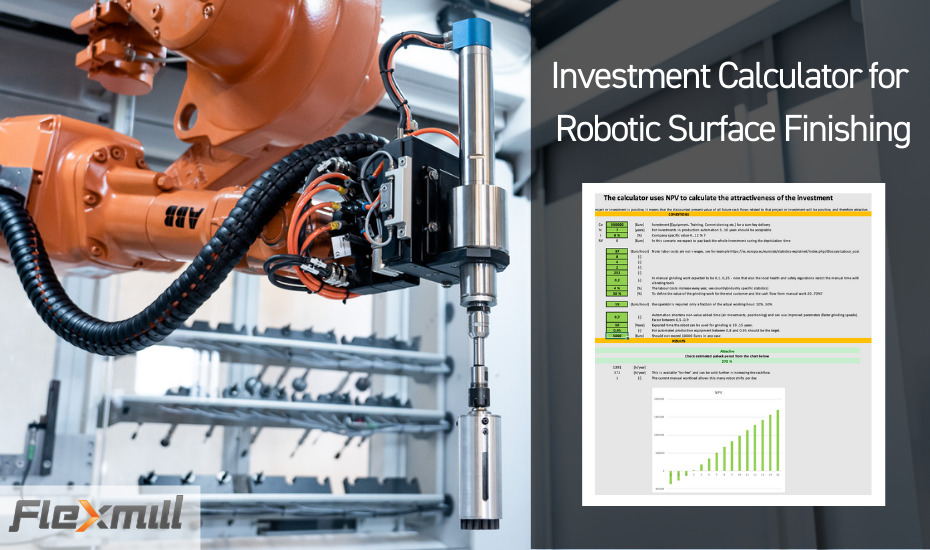
The easiest way to calculate your business case in a structured way is to download our investment calculator and follow the below guidelines. The calculator is built upon the three-step approach. It asks for a series of financial and engineering parameters and calculates the total NPV across the lifecycle, gauging your payback time and ROI on a single chart.
You don’t have to worry about missing out on a value for any of the input parameters. The calculator suggests realistic, best-practice industry values for each input field so that you can fill in the assessment even with incomplete data.
The first step is to enter the investment data into the calculator. If help is needed contact Flexmill to get ballpark figures to ensure all cost items are included – the system and related services.
Total Investment (Co) – Total costs of the robotic investment, including equipment, training, commissioning, warranty, etc. The total investment costs depend on the size and number of different work pieces, as well as the number of individual features and the production batch sizes.
Depreciation time (N) – Enter the period to be used for depreciating the robot investment (in years). In production automation, typically, a period of 5-10 years is used.
Internal Rate of Return (i) – This is a company-specific value used to determine the time value of money (net present value, NPV). The calculator suggests a best-practice industry value.
Residual Value (RV) – Residual value denotes the bookkeeping value of the robot at the end of the investment lifecycle. Typically, the investment is paid in whole during the depreciation time, leaving a zero residual value.
Hourly Labour Cost – Total labor cost includes the total hourly expenditure of employing surface finishing staff. It consists of full employee compensation, including salaries, benefits, employers’ social security contributions, vocational training costs, recruitment costs, working clothes, and taxes. (Please refer to the international labor costs statistics on the calculator.)
Working Time – The annual working time your staff spends on manual surface finishing currently is tracked down in the calculator through the following parameters:
Manual Tool-on-Contact time factor – In manual grinding work, the tool-on-contact time factor is typically between 0,1 and 0,4. It might be difficult to put an accurate figure here, but the calculator suggests an industry best-practice value.
Increase of the future labor costs – The labor costs increase every year. You can search for country and industry-specific statistics.
Sales Margin – Sales margin of the manual surface finishing work is needed in the calculator for estimating the end-customer value of the grinding work for defining the cash flow generated by the manual work. Consult your management about your current sales margin.
Operator Cost – What’s the average hourly cost of a robot operator in your case? Operators are typically required only for a fraction of the actual working hours ranging from 10% to 50%.
Robotic Tool-on-Contact time factor – Indicates process efficiency of programmed robotic grinding. A robot’s tool-on-contact time factor can be even up to three-time higher than manual work, and it varies between 0,5 and 0,9.
Robot Lifetime – Enter the expected operational lifetime of a robot in accounting – typically between 10 and 15 years for grinding applications.
Robot Availability – Availability of automated production equipment such as a grinding robot is typically between 90% and 95% of the time. If this is unclear, please refer to the best-practice value suggested by the calculator.
Robot Maintenance Cost – Annual maintenance costs of a grinding robot can be €5,000, and should never exceed €10,000. Please contact a robotic surface finishing specialist for details. Contact your local robot supplier for details.
Download our robotics surface finishing investment calculator to estimate your payback time and ROI for a robot investment. The calculator suggests best-practice industry values for all input fields, helping you calculate a convincing business case to robotize your process for higher profits and faster growth!
Remember, not all benefits of robotic surface finishing are quantifiable in financial terms, but the value can be significant for your business. Imagine these three examples:
The calculator is built upon the three-step approach. It asks for a series of financial and engineering parameters and calculates the total NPV across the lifecycle, gauging your payback time and ROI on a single chart.


Download our investment calculator with best-practice industry input values, helping you to create a convincing business...

World leading abrasives and power tools manufacturer Mirka Ltd. announces Finnish robotics company...

Our previous article described the best-practice process for programming a surface grinding robot. During that process, you have to make...